KEGG enrichment analysis with clusterProfiler
Last updated on 2026-05-26 | Edit this page
Overview
Questions
- How can we perform pathway analysis using KEGG?
- What insights can KEGG enrichment provide about differentially expressed genes
Objectives
- Learn how to run KEGG over-representation and GSEA-style analysis in R.
- Understand how to interpret pathway-level results.
- Generate and visualise KEGG pathway figures.
ERROR
Error in `library()`:
! there is no package called 'edgeR'
ERROR
Error in `library()`:
! there is no package called 'goseq'
ERROR
Error in `library()`:
! there is no package called 'fgsea'
ERROR
Error in `library()`:
! there is no package called 'EGSEA'
ERROR
Error in `library()`:
! there is no package called 'clusterProfiler'
ERROR
Error in `library()`:
! there is no package called 'org.Mm.eg.db'
ERROR
Error in `library()`:
! there is no package called 'ggplot2'
ERROR
Error in `library()`:
! there is no package called 'enrichplot'
ERROR
Error in `library()`:
! there is no package called 'pathview'
ERROR
Error in `library()`:
! there is no package called 'edgeR'
ERROR
Error in `library()`:
! there is no package called 'impute'
ERROR
Error in `library()`:
! there is no package called 'preprocessCore'
ERROR
Error in `library()`:
! there is no package called 'RegEnrich'
Introduction
The KEGG (Kyoto Encyclopedia of Genes and Genomes) database links
genes to curated biological pathways, offering a powerful foundation for
understanding cellular functions at a systems level and making
meaningful biological interpretations. clusterProfiler
allows us to access KEGG and apply both ORA (using
enrichKEGG function) and GSEA (using gseKEGG
function) to extract pathway-level insights from our RNA-seq data.
KEGG analysis
Before running enrichment, we need to confirm the correct KEGG
organism code for mouse (mmu). You can verify by
searching:
R
kegg_organism <- "mmu"

search_kegg_organism(kegg_organism, by='kegg_code')
ERROR
Error in `search_kegg_organism()`:
! could not find function "search_kegg_organism"
Over-representation analysis with enrichKEGG
To run ORA using KEGG database, we need to specify the gene list,
KEGG organism code and p-value cut-off. In this example, we take the top
500 genes from the ranked gene list debasal_genelist,
specify the organism code mmu (defined as `kegg_organism)
and use 0.05 as the p-value cut-off.
We can use head() function to briefly inspect the
results of enrichKEGG.
R
kk <- enrichKEGG(gene         = names(debasal_genelist)[1:500],
                 organism     = kegg_organism,
                 pvalueCutoff = 0.05)
ERROR
Error in `enrichKEGG()`:
! could not find function "enrichKEGG"
R
head(kk)
ERROR
Error:
! object 'kk' not found
GSEA-style KEGG enrichment with gseKEGG
Similar to previous enrichment analysis with GO database, we can also
perform a GSEA-style enrichment using the KEGG database. To do so, we
use the gseKEGG and specify the entire ranked gene list
(debasal_genelist) rather than an arbitrary cutoff. In this
example, we test KEGG pathways between 3 and 800 genes using 10,000
permutations and NCBI Gene IDs. Results are filtered using a p-value
cut-off of 0.05.
R
kk2 <- gseKEGG(geneList     = debasal_genelist,
               organism     = kegg_organism,
               nPerm        = 10000,
               minGSSize    = 3,
               maxGSSize    = 800,
               pvalueCutoff = 0.05,
               pAdjustMethod = "none",
               keyType       = "ncbi-geneid")
ERROR
Error in `gseKEGG()`:
! could not find function "gseKEGG"
Visualising enriched pathways
Dotplot
Before we look at individual pathways in detail, we can visualise the
overall enrichment results using dotplot().
This dotplot summarises which KEGG pathways are enriched, how many genes
contribute to each pathway, and how significant each one is.
R
dotplot(kk2, showCategory = 10, title = "Enriched Pathways" , split=".sign") + facet_grid(.~.sign)
ERROR
Error in `dotplot()`:
! could not find function "dotplot"
Similarity-based network plots
Next, we can explore how the enriched pathways relate to one
another.
The enrichment map groups pathways that share many genes, helping us see
broader biological themes rather than isolated pathways. In this case,
pairwise_termsim() function calculates the similarity
between enriched KEGG pathways and produces a similarity matrix that
quantifies their relationship. The emapplot()generates an
enrichment map using the similarity matrix produced, visualising the
enriched pathways as a network with nodes representing pathways and
edges reflecting their similarity.
R
kk3 <- pairwise_termsim(kk2)
ERROR
Error in `pairwise_termsim()`:
! could not find function "pairwise_termsim"
R
emapplot(kk3)
ERROR
Error in `emapplot()`:
! could not find function "emapplot"
We can also use cnetplot() to understand which genes
drive these enriched pathways. This plot links genes to pathways they
belong to and highlights genes that appear in multiple pathways.
R
cnetplot(kk3, categorySize="pvalue")
ERROR
Error in `cnetplot()`:
! could not find function "cnetplot"
Ridge plot
We can also inspect the distribution of enrichment scores across
pathways with ridgeplot(). This shows how strongly and
broadly each pathway is enriched across the ranked gene list using
overlapping density curves.
R
ridgeplot(kk3) + labs(x = "enrichment distribution")
ERROR
Error in `ridgeplot()`:
! could not find function "ridgeplot"
R
head(kk3)
ERROR
Error:
! object 'kk3' not found
You can see the top pathways, you can get the top pathway ID with the ID column.
R
# There must be a function that gets the results -> not ideal code
kk3@result$ID[1]
ERROR
Error:
! object 'kk3' not found
KEGG Pathway Diagram
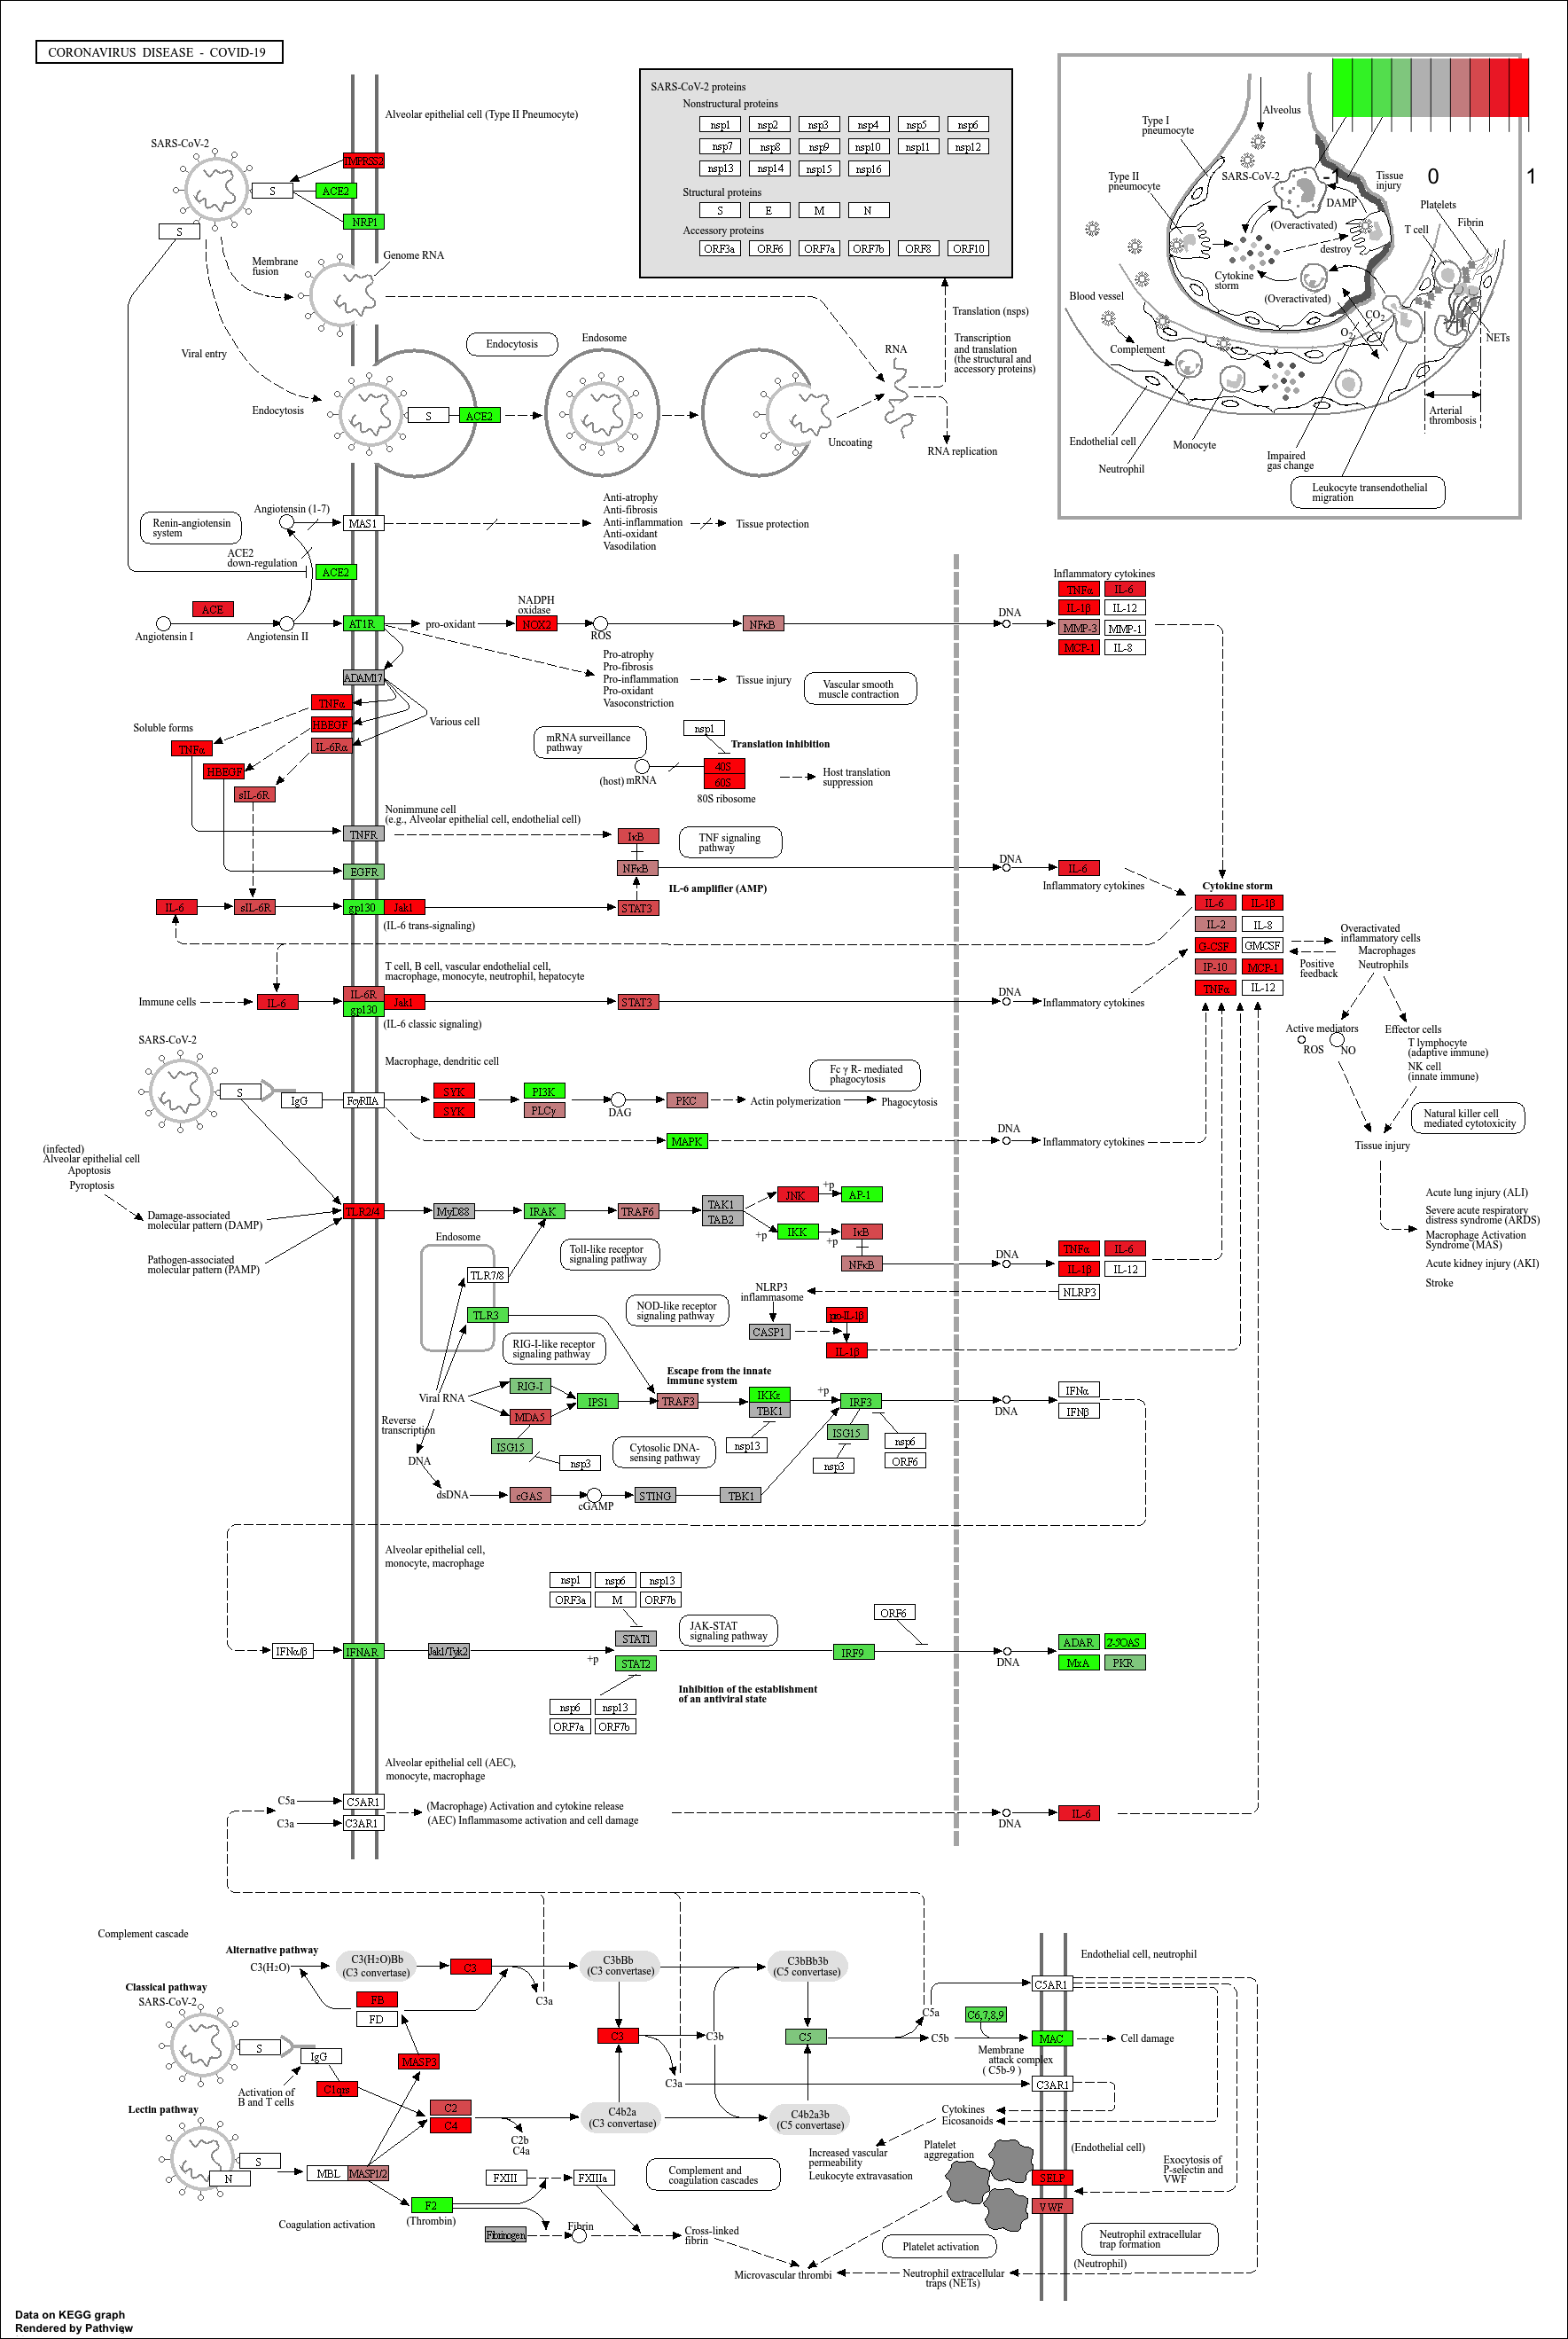
Finally, we can visualise gene expression changes directly onto a
KEGG pathway diagram.pathview highlights which components of the pathway are up-
or down-regulated in your enrichment analysis.
R
# Produce the native KEGG plot (PNG)
mmu_pathway <- pathview(gene.data=debasal_genelist, pathway.id=kk3@result$ID[1], species = kegg_organism)
These will produce these files in your working directory:
mmu05171.xml mmu05171.pathview.png mmu05171.png
KEGG pathway analysis helps link DEGs to functional biological pathways.
Both ORA (
enrichKEGG) and GSEA-style (gseKEGG) methods provide complementary insights.pathviewenables visual interpretation of pathway-level expression changes.