All Images
Exploring the dataset
Processing data with DIA-NN
Figure 1
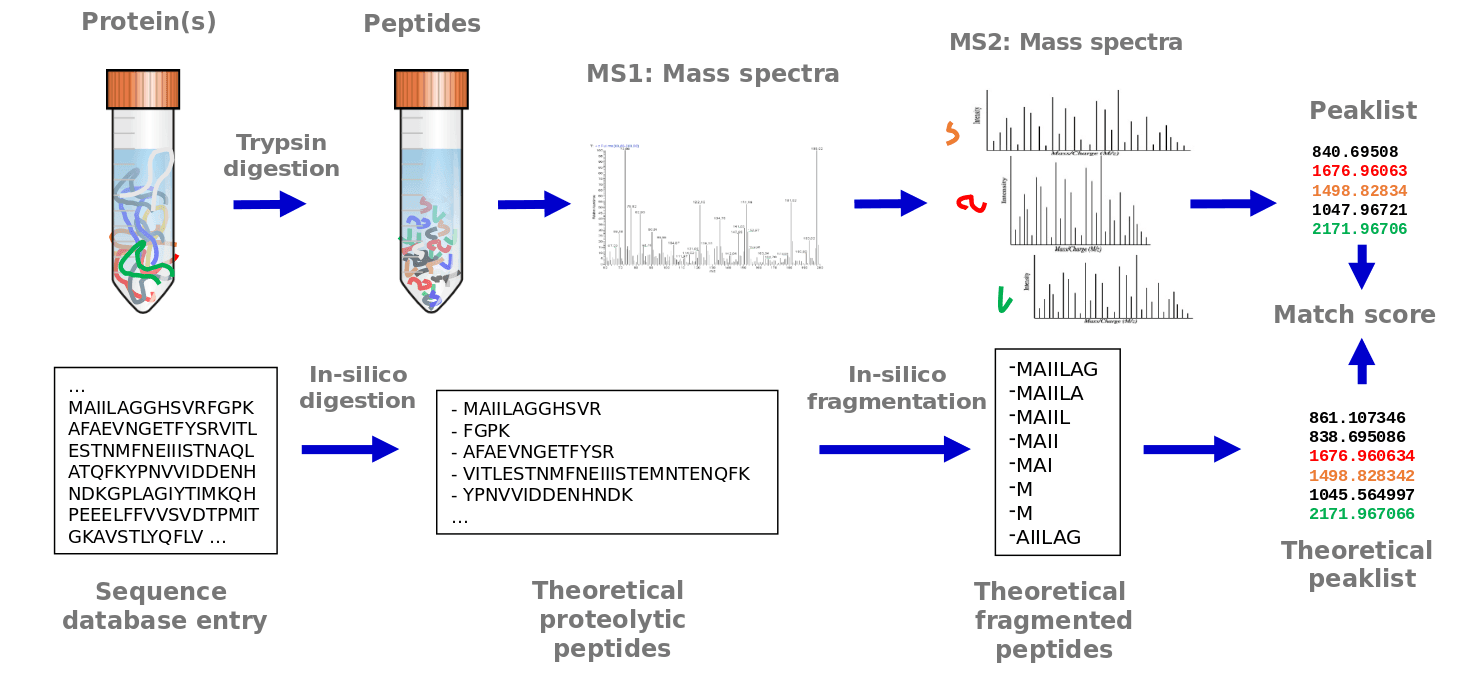
Proteomics software like DIA-NN match observed
spectra against a spectral library to identify peptides and assign them
to a protein or protein group. Source: Galaxy
Training Network
Figure 2
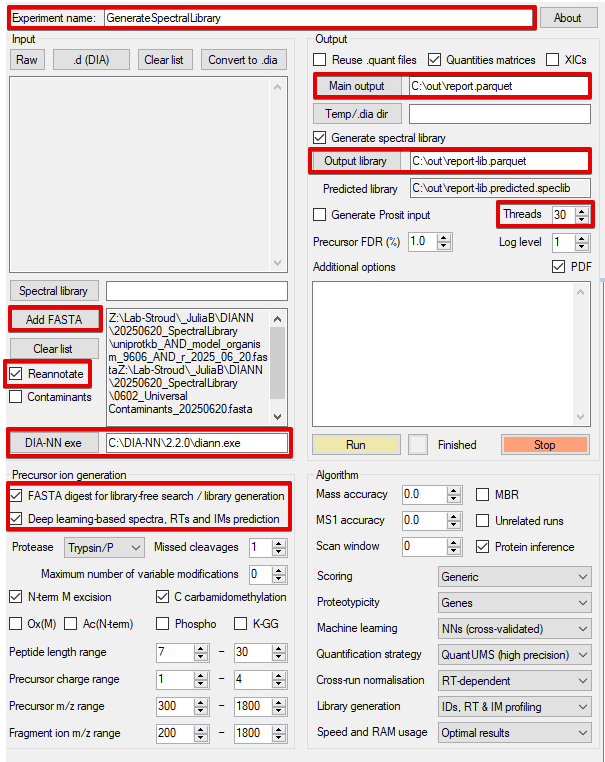
Example of the DIA-NN GUI used to generate a
predicted spectral library. Settings which have been altered from the
default are highlighted in red.
Figure 3
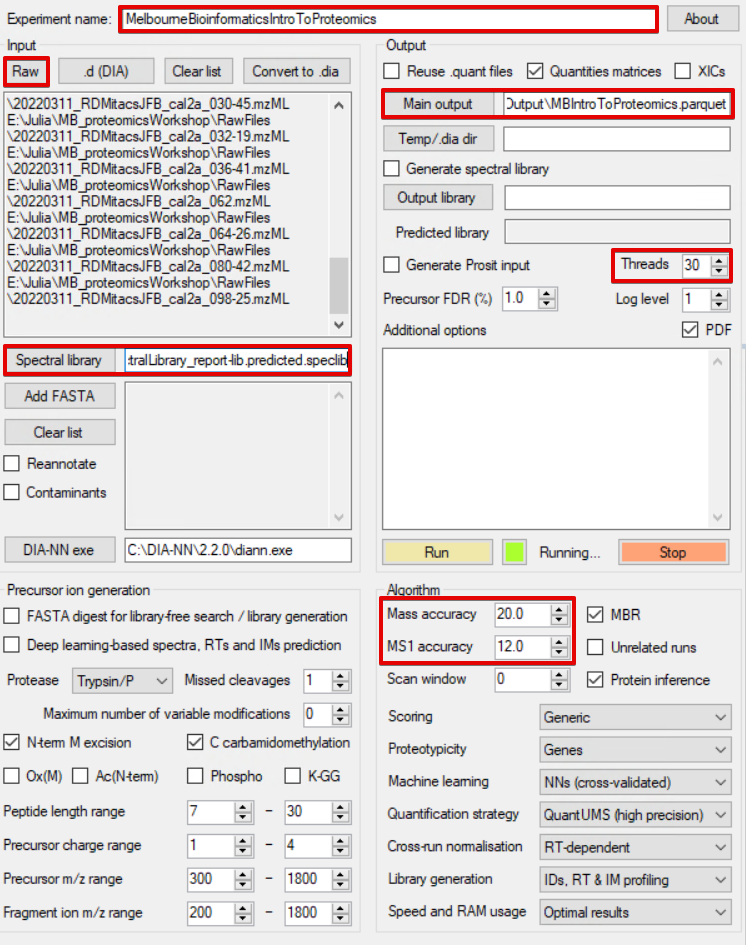
Example of the DIA-NN GUI used to analyse the
data described in this tutorial. Settings which have been altered from
the default are highlighted in red.
Data cleaning with R
Figure 1
Figure 2
Figure 3
Figure 4
Figure 5
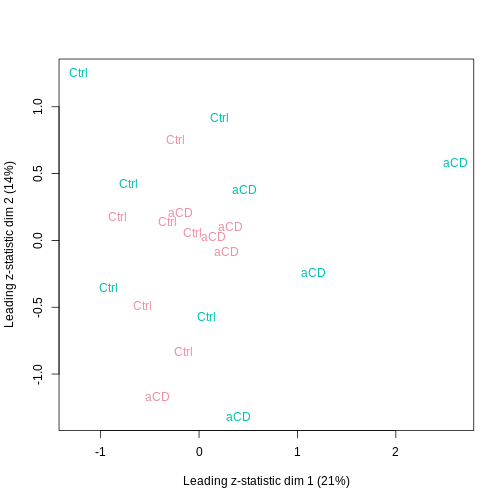
Differential expression analysis
Figure 1
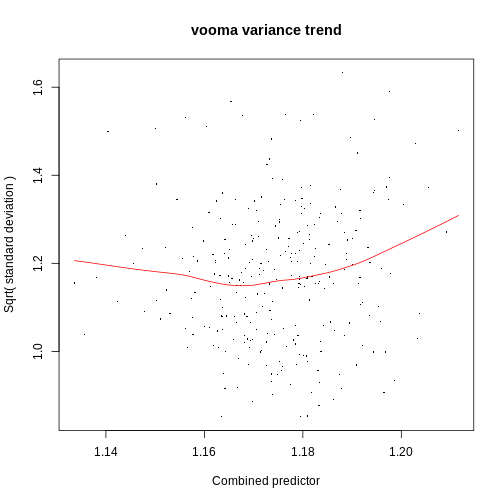
Figure 2
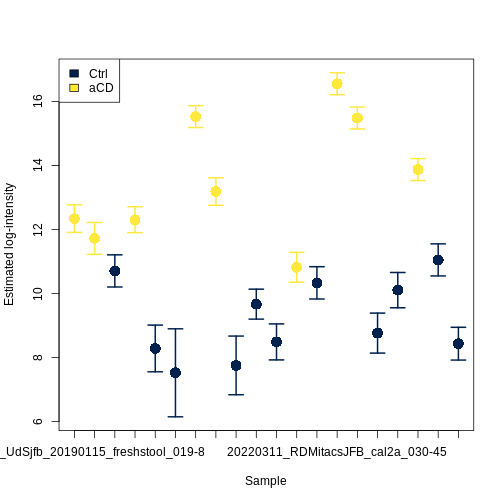
Figure 3
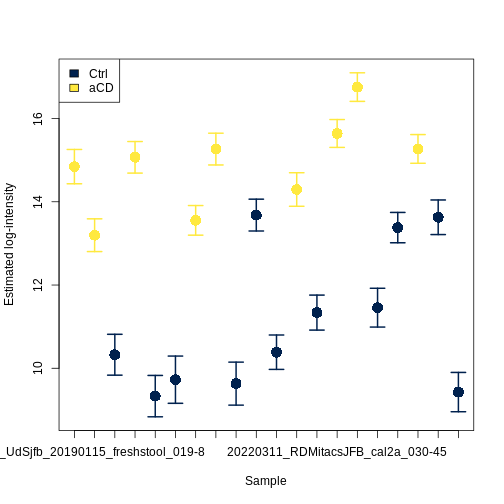
Figure 4
Figure 5
Figure 6
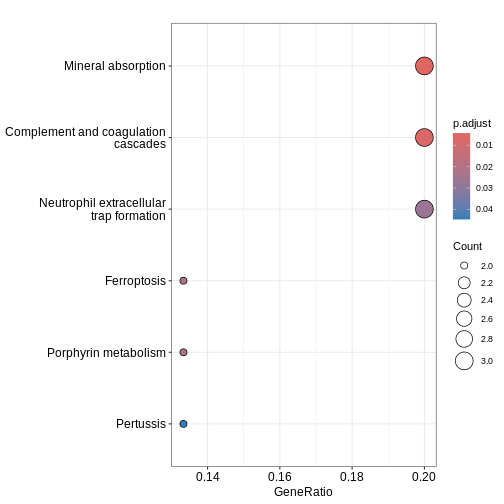
Network and Enrichment Analysis
Figure 1
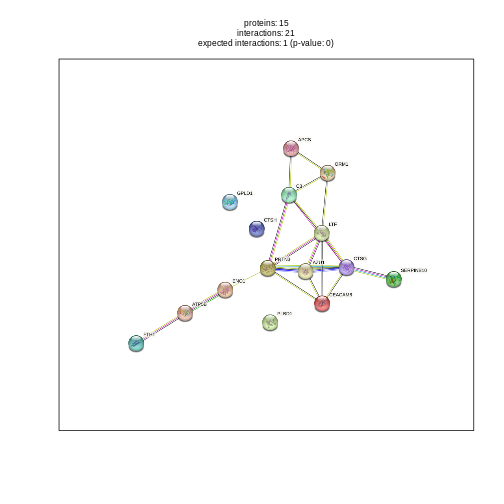
Figure 2
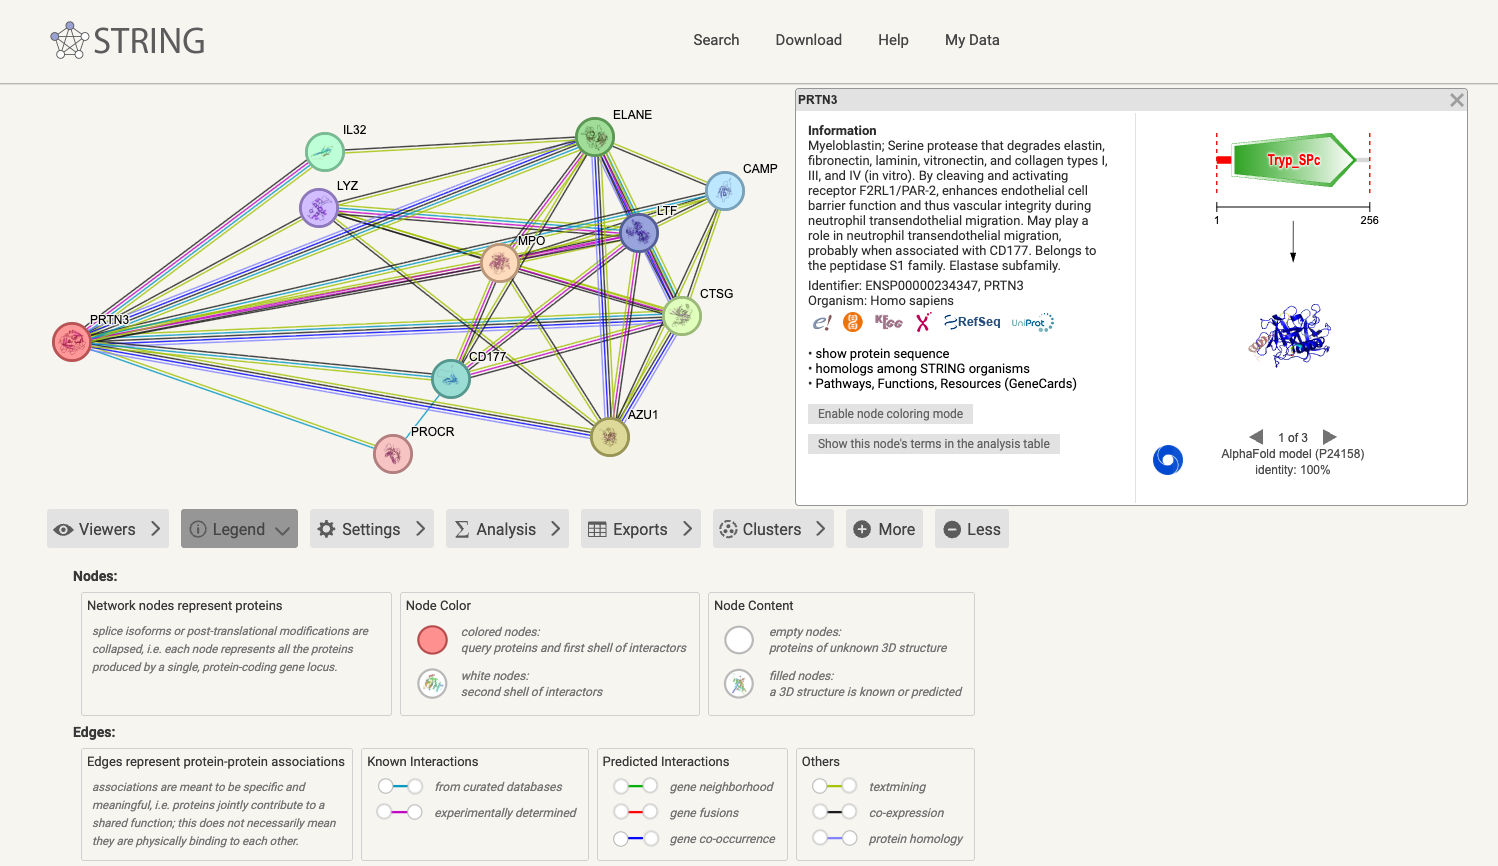
Network plot for PRTN3 from string-db.org
Figure 3
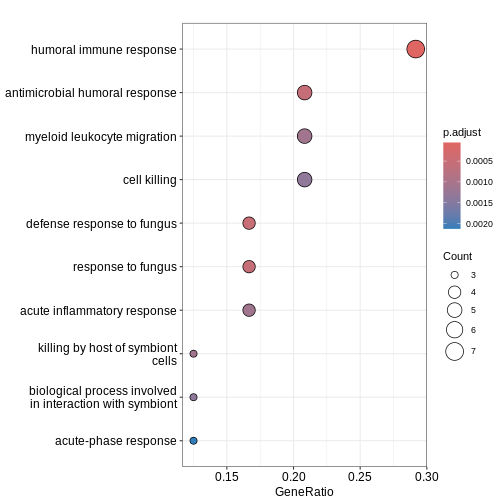
Figure 4