
Background
Last updated on 2026-10-06 | Edit this page
Overview
Questions
- Why is the fat‑tailed dunnart a useful model for microbiome studies?
- What are the expected experimental differences between captive and wild animals?
- Why use a byobu / screen session on a remote instance?
- What are symbolic links and why are they used here?
Objectives
- Place the dataset in ecological and conservation context.
- Relate host ecology and sample provenance to interpretation of microbiome results.
- Launch and reconnect to a persistent byobu‑screen session.
- Create symbolic links to shared tutorial data to avoid redundant copies.
What is the influence of captivity on gut microbiota of the fat-tailed dunnart?
The Players
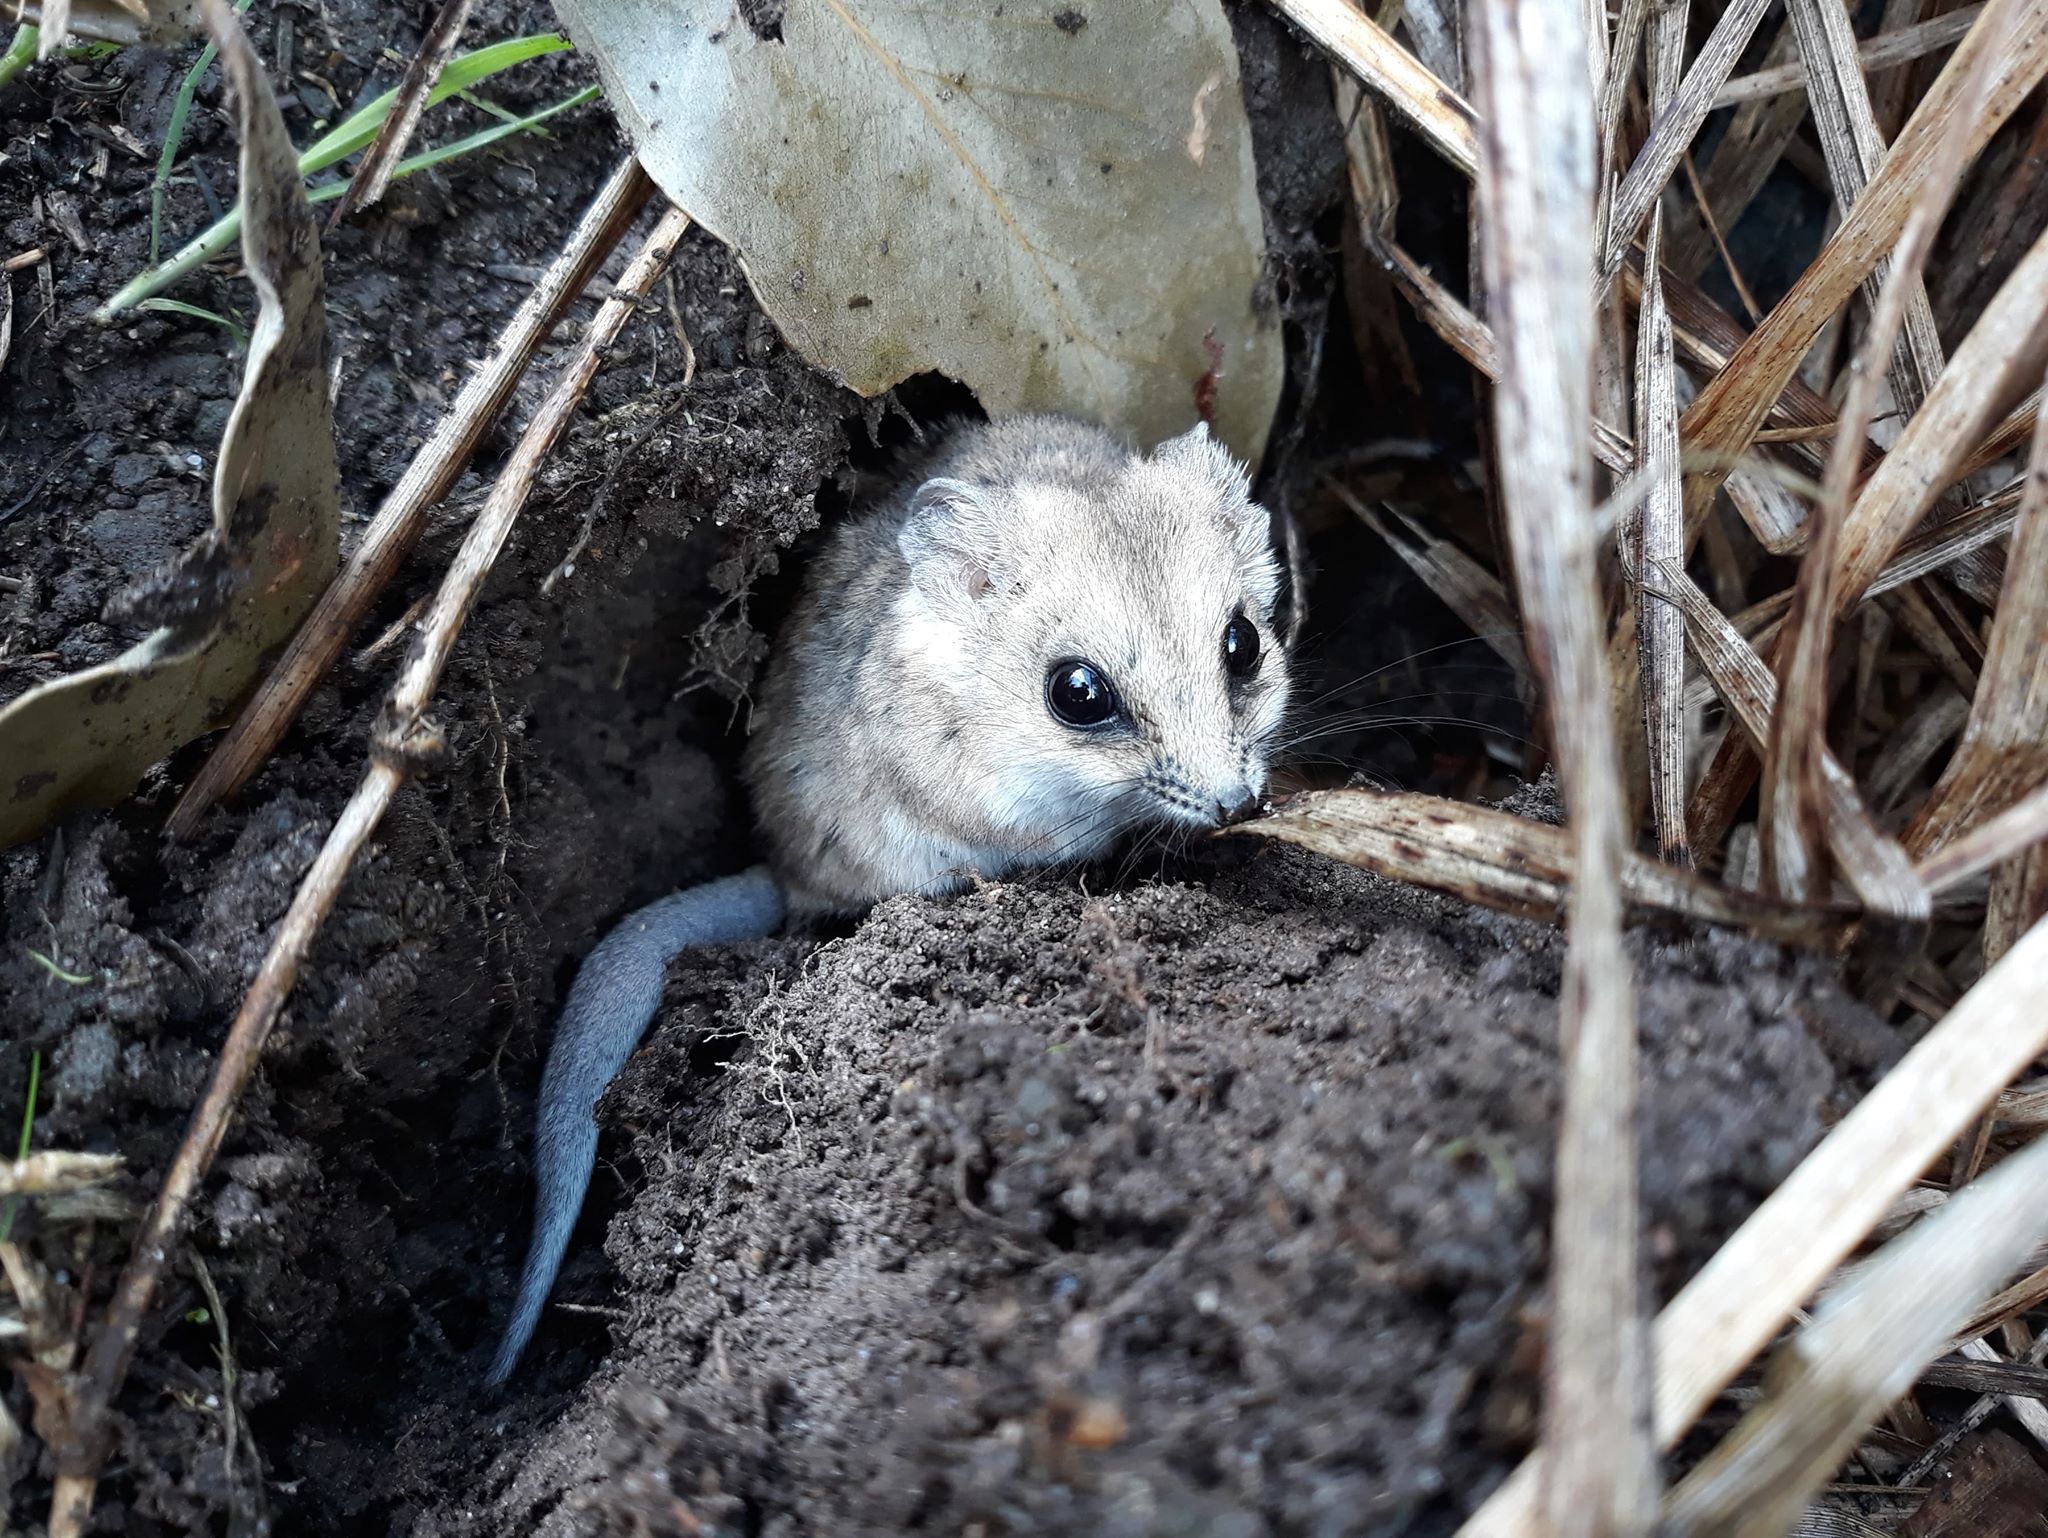 (Photo credit: Emily
Scicluna)
(Photo credit: Emily
Scicluna)
- Fat-tailed dunnart Sminthopsis crassicaudata - a species of mouse-like marsupial in the family Dasyuridae, which includes quolls, the Tasmanian devil, and the extinct Thylacine. There are 10 samples in this dataset (This data is a subset from a larger experiment); 5 faecal samples each from captive and wild fat-tailed dunnarts.
The Study
Indigenous microbial communities (microbiota) play critical roles in host health. Small marsupials, such as the fat-tailed dunnart, are increasingly used as model systems to understand how environmental conditions shape host-associated microbiomes. Transitions between wild and captive environments can substantially alter diet, behaviour, and microbial exposure, providing a natural framework to investigate microbiome restructuring and its potential consequences for host physiology and health. Here, we characterise the gut microbiome of wild and captive fat-tailed dunnarts to assess how captivity influences microbial community composition. This dataset represents a subset of a larger experimental framework examining microbiome-mediated effects on host function and conservation outcomes.
QIIME 2 Analysis platform
The version used in this workshop is qiime2-2026.1.
Other versions of QIIME2 may result in minor differences in results.
Quantitative Insights Into Microbial Ecology 2 (QIIME 2™) is a next-generation microbiome bioinformatics platform that is extensible, free, open source, and community developed. It allows researchers to:
- Automatically track analyses with decentralised data provenance
- Interactively explore data with beautiful visualisations
- Easily share results without QIIME 2 installed
- Plugin-based system — researchers can add in tools as they wish
Viewing QIIME2 visualisations
In order to use QIIME2 View to visualise your files, you will need to use a Google Chrome or Mozilla Firefox web browser (not in private browsing). For more information, click here.
As this workshop is being run on a remote Nectar Instance, you will need to download the visual files (*.qzv) to your local computer and view them in QIIME2 View (q2view).
We will be doing this step multiple times throughout this workshop to view visualisation files as they are generated.
Alternatively, if you have QIIME2 installed and are
running it on your own computer, you can use
qiime tools view to view the results from the command line
(e.g. qiime tools view filename.qzv).
qiime tools view opens a browser window with your
visualization loaded in it. When you are done, you can close the browser
window and press ctrl-c on the keyboard to terminate the
command.
- Captivity can alter diet, exposure and behaviour — all of which may reshape the gut microbiome.
- The dataset contains a small, balanced subset (5 captive, 5 wild) suitable for teaching and demonstrating methods.
- Use byobu-screen to keep long‑running commands alive across disconnections.
- Symlinks point to /mnt/shared_data to conserve storage and keep everyone working from the same files.