UCSC Genome Browser: Gene expression data
Last updated on 2025-12-22 | Edit this page
Overview
Questions
- How can we explore gene expression data in the UCSC genome browser?
Objectives
Use the UCSC gene browser to:
- Compare a region of one genome to genomes of other species
- Determine the tissue/cell type expression profiles of a gene of interest in mouse and human expression data
Viewing GTEx data in the UCSC Genome Browser
Human tissue specific expression data from the GTEX project is available in the UCSC genome browser.
Gene level expression data from
GTEx Gene V8donors can be turned on from the blue bar underExpression. These are displayed as coloured bar plots.Transcript level expression data is available by turning on
GTEx Transcriptunder the same blue bar. This is also displayed as bar plots.-
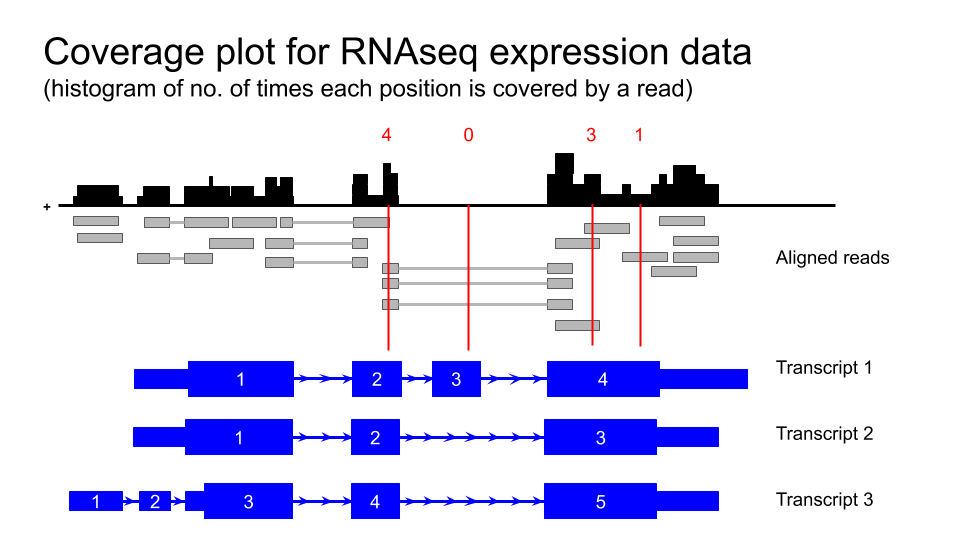
Transcript level expression data for GTEx V6 is also available as coverage plots.
Toolbar > My data > Track Hubs- Scroll down to
GTEx RNA-seq Signal Hub. Selecthg38

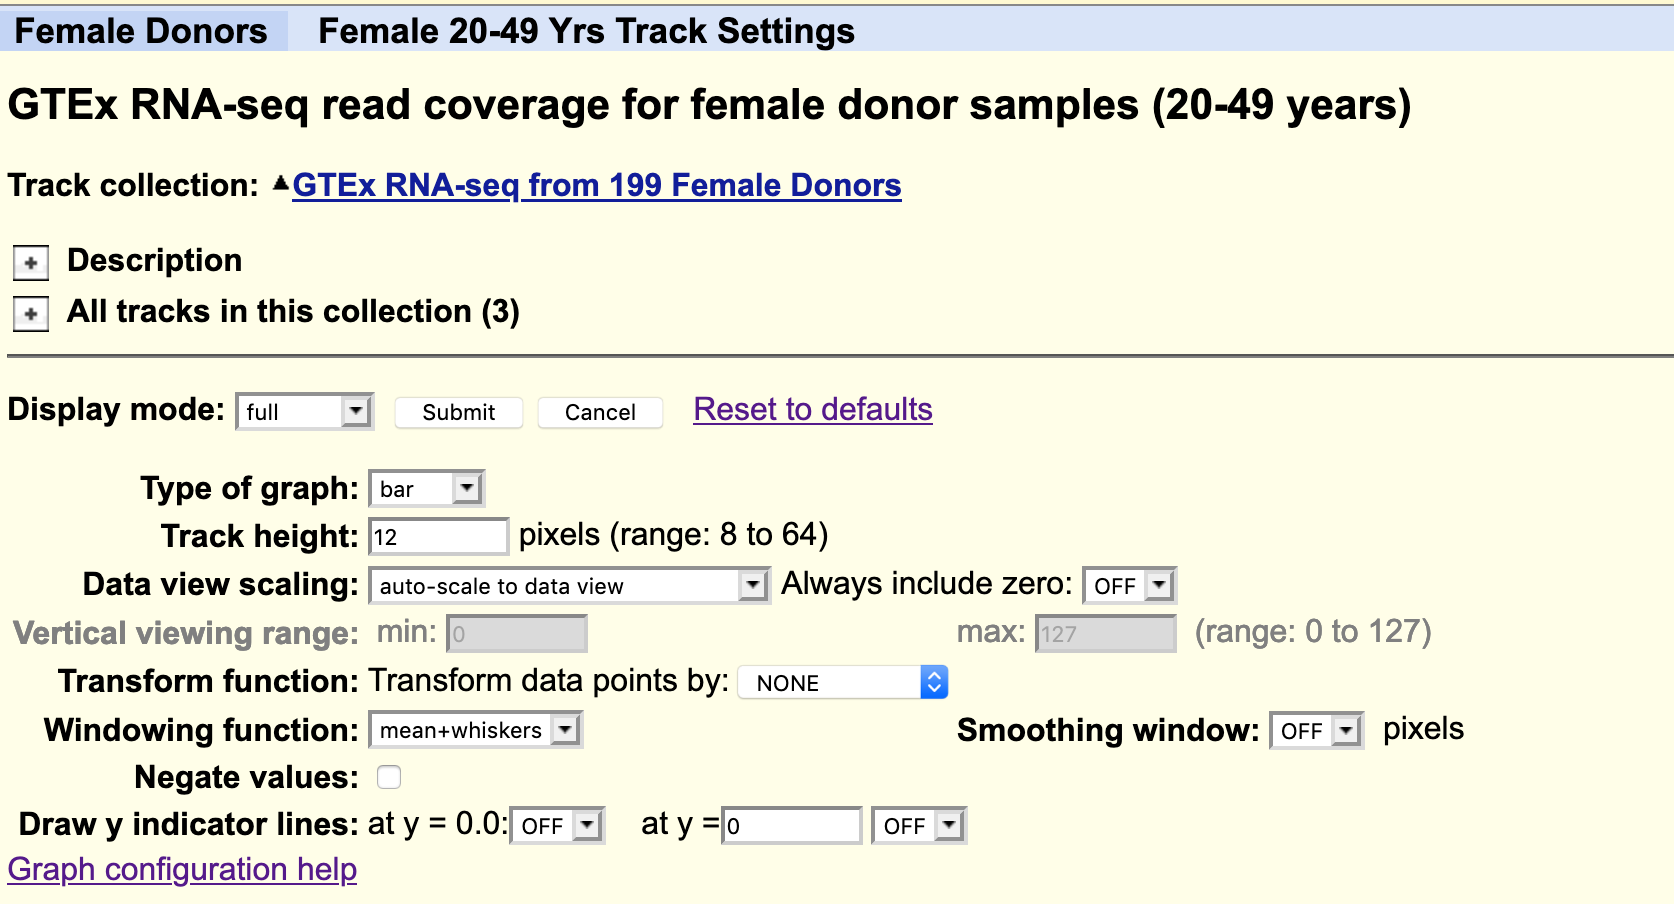
Default settings
By default, all the available data from one individual only is loaded. Data from other subjects in the study can be loaded as desired. For example, you could load all available samples for one tissue region only.
The data is autoscale to data view with a track height or 12 pixels for each samples. You can change the height of the track or add a data transformation.
As usual, you can right click on the grey bar on the left hand side to configure the track set.
Your task
Using the selection matrix for female donors aged 20-49 years, deselect the default samples and select only Brain cortex and Pancreas samples.
Navigate to the location for the gene MYRF. You can increase the height of the datatrack to improve visualisation.
CHALLENGE 1
Can you locate an exon in the MYRF gene that is present in transcripts expressed in the brain but not in the pancreas?
CHALLENGE 2
Does this alternative splicing event result in a frame shift of the coding sequence?
CHALLENGE 3
How many amino acids are there in the protein products for each MYRF transcript?
FACS data
The FACS derived data from the Tabula Muris cell type data can be visualised as a coverage plot.
Your task
Navigate back to the NTRK2 gene in the human genome. Navigate to the Ntrk2 gene in the mouse genome via
Toolbar > View > In Other Genomes (Convert)Under
New GenomeselectMouse, underNew AssemblyselectGRC38/mm10, then clickSubmitSelect the region with the greatest homology
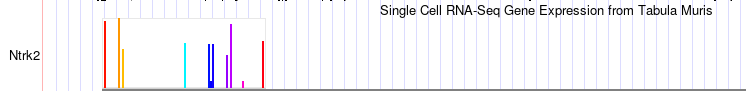
Click on the bar chart icon for the Tabula muris data in the default view to see a summary bar chart of the cell type data.
- To see a coverage plot of the expression data, we have to configure
the Tabula Muris track.
- Right click on the grey bar to
Configure Tabula Muris track set - Hide
Cell expression - Select
Genome coverageto full - Select
submit
- Right click on the grey bar to
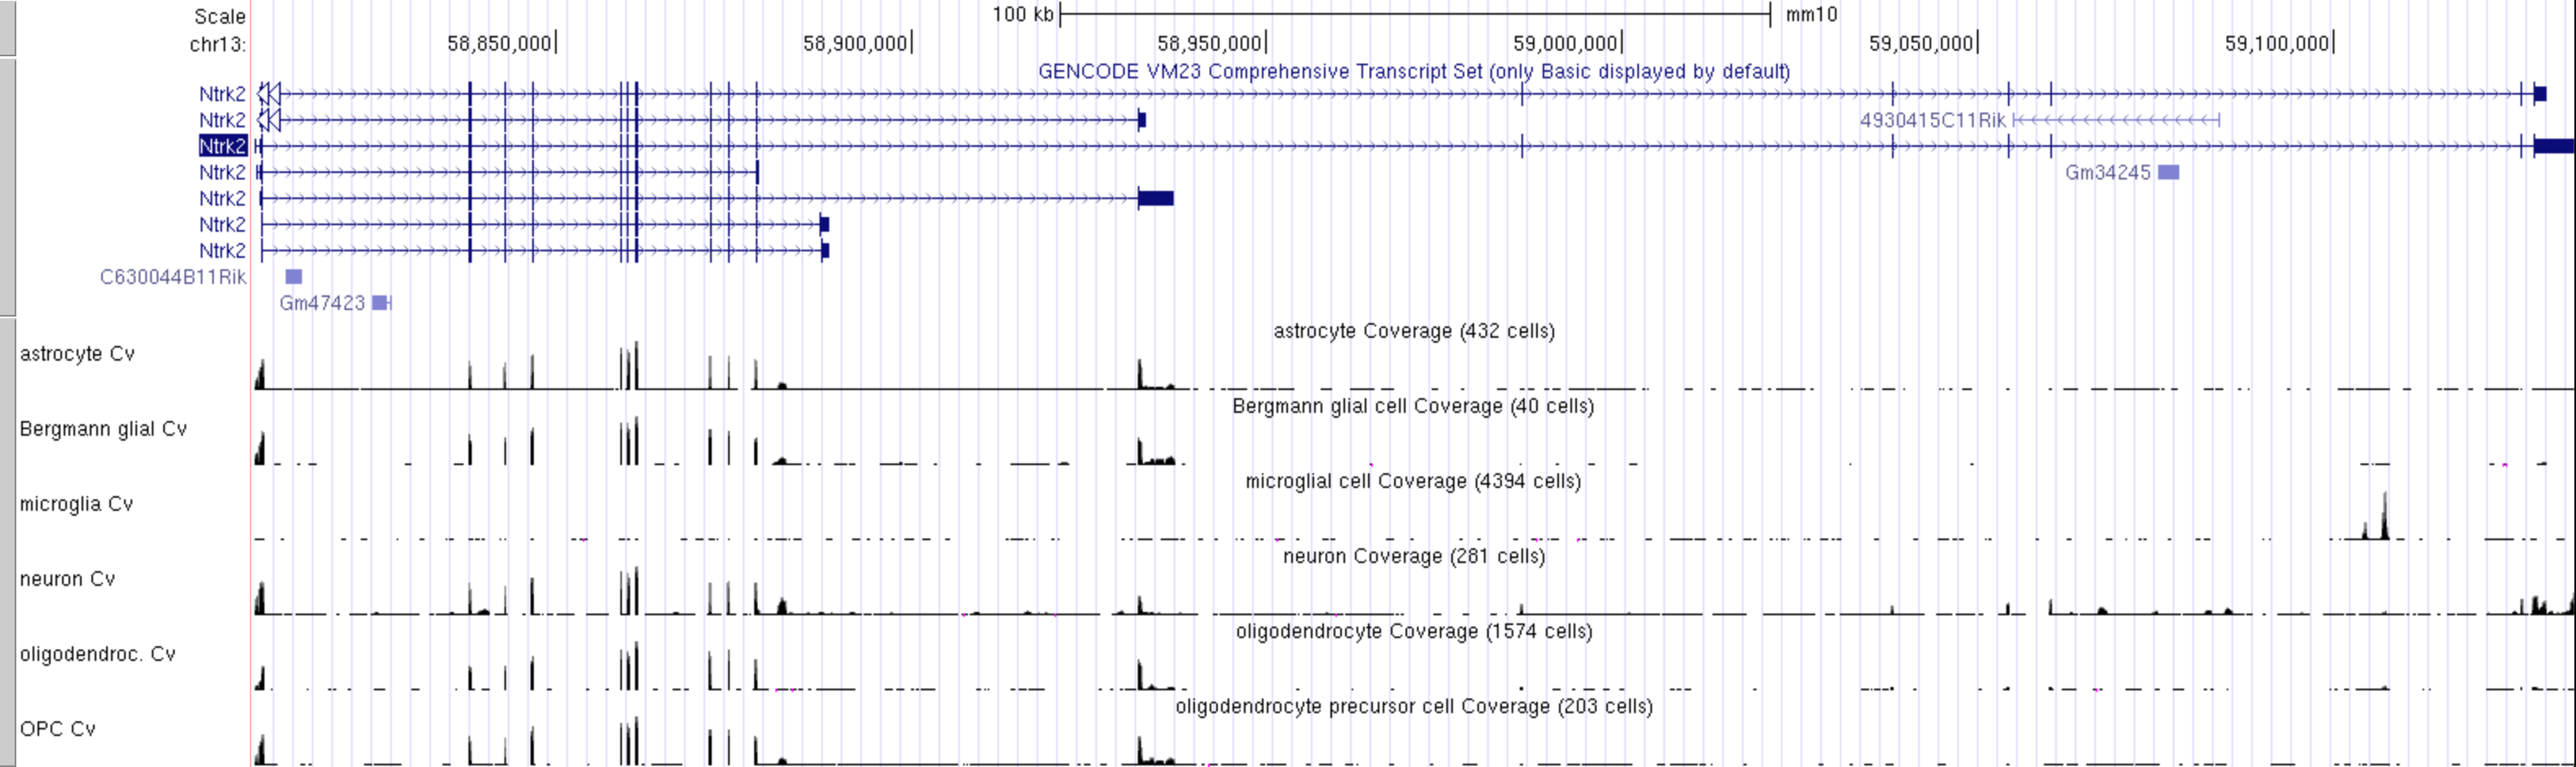
This can look a bit overwhelming as there are many tracks and the default track height is set very high, but it is easy to simplify it by focusing on a few cell types of interest.
- Right click on the grey bar to
configure Genome Coverage track set- Change
Track heightto 30 pixels - for
Data view scalingselectgroup auto-scale -
Hide Allsubtracks and then manually select only these few cell types of interest:- astrocyte Cv
- Bergmann glial Cv
- microglia Cv
- neuron Cv
- oligodendrocyte Cv
- OPC Cv
Submit
- Change
CHALLENGE 4
Which cell type has the highest level expression of Ntrk2 in this dataset?
Go back to the configuration page to change
Data view scalingtoauto-scale to data viewandSubmitExport a PDF image of the genome view:
Toolbar > View > PDFselectDownload the current browser graphic in PDF
CHALLENGE 5
Which cell type(s) express the long and short transcripts of Ntrk2?
Linnarsson lab data
Mouse CNS cell type expression data can also be validated using an independent single cell dataset of mouse cortex from the Linnarsson lab.
The data that is publicly available for viewing in the UCCS genome browser is not housed in the UCSC genome browser. You must first access it from the the Linnarsson lab data page.
This RNAseq data is stranded, meaning you can see if the transcript data is from the + or - strand.
Your task
Click here for the Linnarsson lab public data page for this dataset where you can search for cell expression profiles for individual genes.
-
Click on the
Browse the genomeblue text near the bottom of the page.This loads 18 different tracks, one for each cell type investigated. The default setting for expression range is quite high and most gene expression is not observed with these settings. Each track must be configured individually rather than as a group, which takes a lot of time.
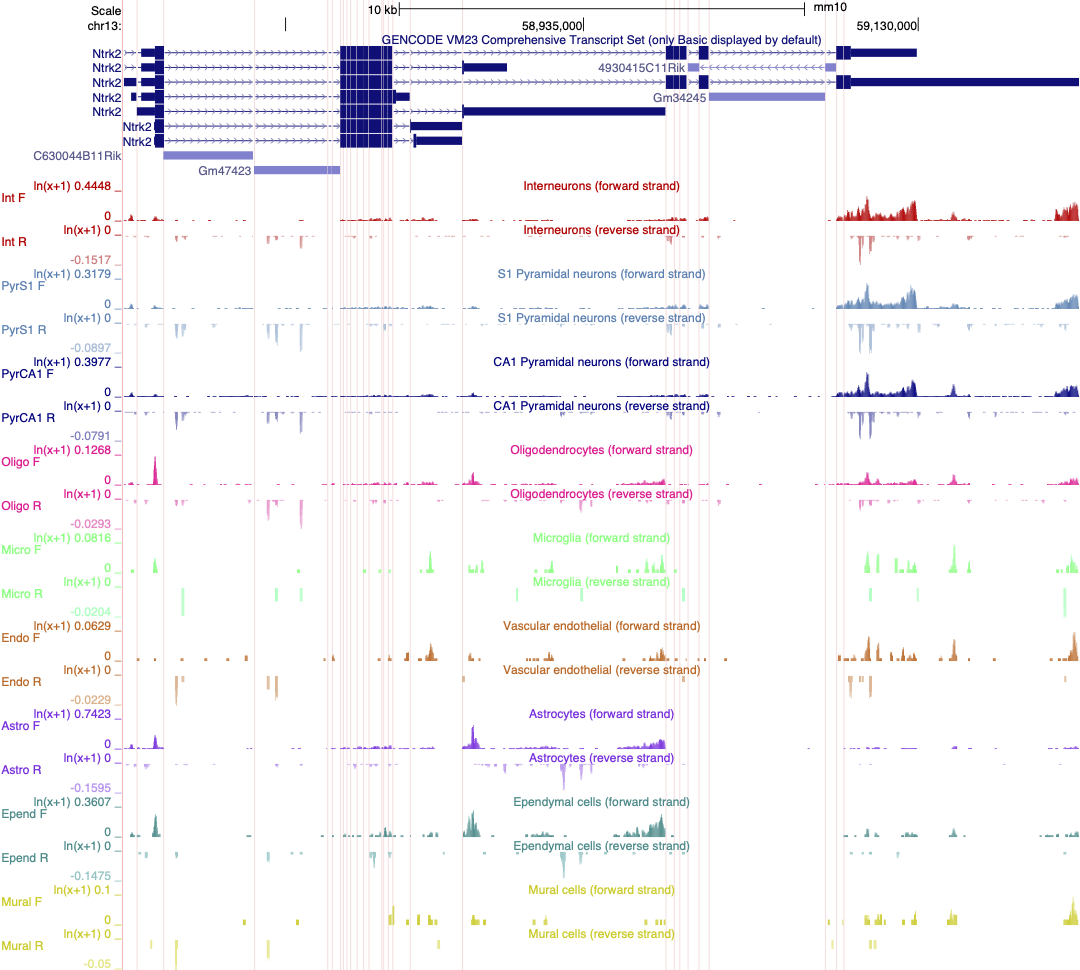
We previously created a version of this data where each track is autoscaled which can make it quicker to determine which expression range would be ideal for visualising the expression of an individual gene. The session is illustrated in the screen shot below. Note that the data is also viewed using ‘Multi-Region’ which hides the introns in the gene models.
CHALLENGE 6
Select two or three cell types in your session and adjust the scale to best reflect differences in gene expression of Ntrk2 between these cells.
Save this session and share it.
- The UCSC genome browser allows you to compare gene expression data from multiple different sources and species